Famous technical analyst John Bollinger have found possible W bottoms in Ethereum (ETH) and Solana (SOL) charts. These are patterns often seen before bullish reversals. However, Bollinger, famous for creating the Bollinger Bands indicator noted that Bitcoin (BTC) is yet to display a similar setup.
Bollinger Highlights Key Divergence Between Bitcoin and Altcoin Setups
In a post on X, Bollinger said both ETH/USD and SOL/USD show possible “W” bottoms in Bollinger Band terms, while BTC/USD does not. He hinted that it might soon be time to “pay attention,” as these setups can signal key inflection points when confirmed.
The “W” bottom, a double-bottom structure within the Bollinger Bands, typically forms when prices dip twice. In most cases, the second low is higher than the first one.
Potential ‘W’ bottoms in Bollinger Band terms in $ETHUSD and $SOLUSD, but not in $BTCUSD. Gonna be time to pay attention soon I think.
— John Bollinger (@bbands) October 18, 2025
This implies that the selling momentum is reducing and buyers are gradually taking control. Once confirmed, it marks the beginning of an upward shift. This growing optimism echoes recent bullish commentary from global investors. Recently, financial educator Robert Kiyosaki called Bitcoin and Ethereum “real money,” citing their resilience amid economic uncertainty.
Bollinger’s remark follows his earlier analysis in April, when he spotted a similar pattern in BTC/USD. Back then, he described it as a “classic Bollinger Band W bottom” that still needed confirmation.
Bitcoin later rallied from that zone, validating his observation and reinforcing his reputation for accuracy in identifying early trend reversals. This time, though, Bollinger’s focus has shifted to Ethereum and Solana, which may now be leading indicators for a broader recovery.
Ethereum Gains Momentum Against Bitcoin, Signaling Possible Altcoin Rotation
TGW Capital, a crypto analytics firm, reposted Bollinger’s statement, emphasizing how his April Bitcoin call had played out. They suggested that ETH and SOL could follow a similar trajectory if current formations hold.
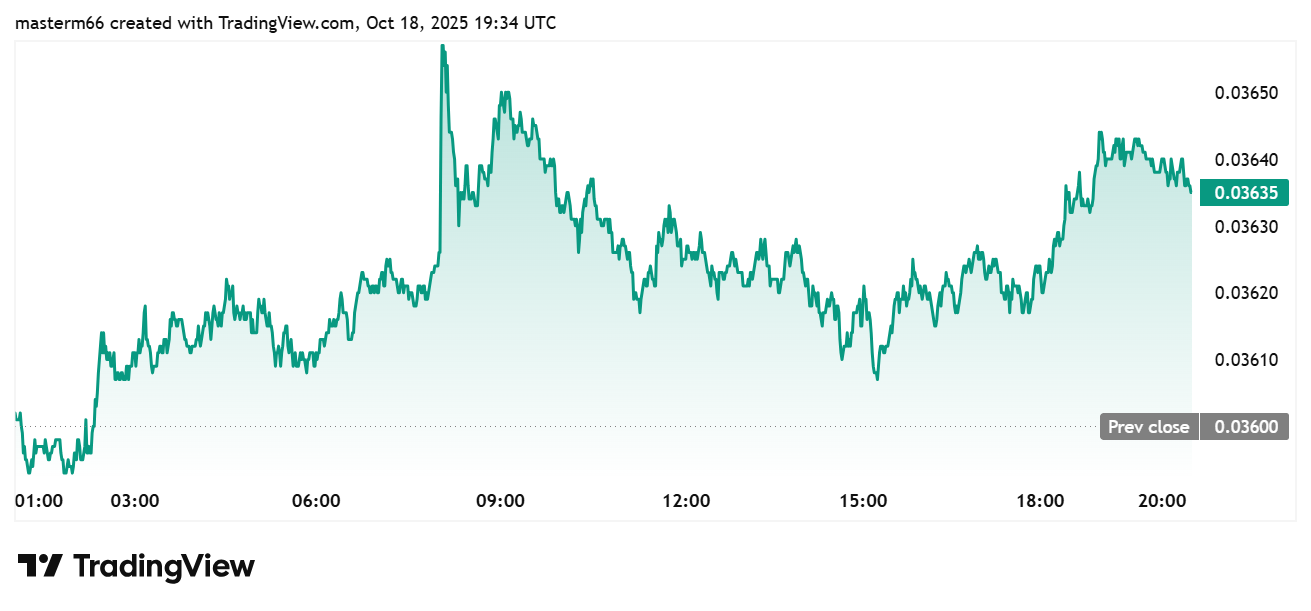
Adding to the optimism, ETH price rose 1.52% in the last 24 hours to around $3,891, while SOL price climbed 2.15% to nearly $186. Recent data supports this shift in market structure. The ETH/BTC pair has climbed 1% in the past 24 hours, showing that Ethereum is gaining strength relative to Bitcoin.
The Ethereum/Bitcoin ratio is over 7% in a week, which indicates capital rotation off Bitcoin and into Ethereum. Institutional flows appear to mirror this shift. BlackRock recently trimmed its Bitcoin holdings while increasing its exposure to Ethereum during the recent market downturn.


This may prove the evaluation of Bollinger that ETH is approaching a possible bottom zone, and BTC is still at a consolidation phase. Usually, the rise in this ratio is followed by a period when altcoins perform better than Bitcoin.
This is called an alt season and it points to a divergence between leading assets. Even though Bitcoin is trading around its major support zone on the weekly chart, ETH and SOL are reacting positively to accumulations again.
